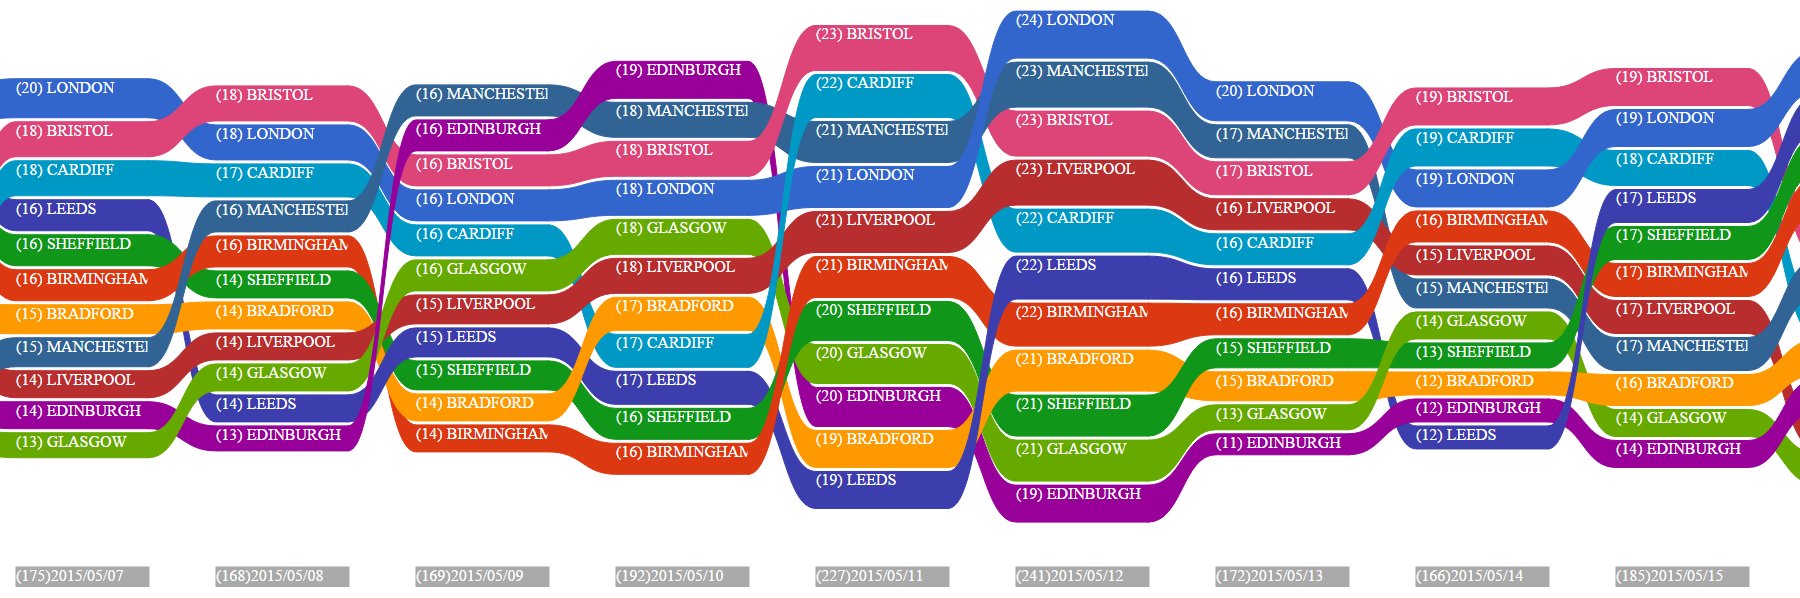
A while ago at work we had a need to display changing ‘share of voice’ or ‘contribution of themes’ information over time. Essentially this would mean displaying the ‘Top 1 themes’ or ‘Top 1 authors’ for each epoch or timespan. The same authors and themes would typically exist in multiple epochs, but not necessarily contiguously; authors/themes could appear for a few epochs, disappear again and then reapppear later on, and new themes could appear at any point. But for this fact, a stacked area graph or a classic stream graph would work perfectly. Some WWW research, however, soon revealed this lovely graph. It is able to show the proportional sizes of the entities in each epoch, their changes in ‘rank’, and allows for entities to ‘join’ and leave, starting and ending streams over their lifetimes. Unfortunately, no source was available and I was unable to find any implementations at all. The only option was to do it myself, the results of which are here.
To keep things simple, and instantly useful, there were three constraints:
- Implement in generic javascript with minimal dependencies - only jquery for handling json data.
- Use SVG for the actual drawing - this is now fairly standard across browsers and requires no 3rd party libraries.
- Use the json data produced by the API of our in-house data processing software, DexterDiscovery.
The library code is here and there is a working example at the end of the post.
How it works
1. Organise the data
The first stage of processing is to fetch the graph’s data - this arrives a json in the following format:
1 2 3 4 5 6 7 8 9 | {"itemCountsByDate": [ {"score":7, "partition":"BIRMINGHAM", "name":"BIRMINGHAM", "date":1393632000000}, {"score":6, "partition":"BRADFORD", "name":"BRADFORD", "date":1393632000000}, {"score":8, "partition":"BRISTOL", "name":"BRISTOL", "date":1393632000000}, {"score":6, "partition":"GLASGOW", "name":"GLASGOW", "date":1393632000000}... {"score":9, "partition":"LEEDS", "name":"LEEDS", "date":1395360000000} ] } |
Each object represents a count of items of a particular category or series (‘partition’) and at a particular point in time (‘date’ : number of milliseconds since 01/01/1970).
We use jquery to fetch the data and then we ‘bin’ the items into particular epochs (we do this by converting the ‘date’ value into a sortable string representation, e.g. ‘2015/06/05’ and adding the items to a ‘StreamColumn’ object representing that date).
1 2 3 4 5 6 7 8 9 10 11 12 13 14 15 16 17 18 19 | $.each( data.itemCountsByDate, function( key, val ) { var date = new Date(val.date); //create 'x' scale of dates in format 'yyyy/MM/dd' var dateStr = (date.getFullYear()+'/'+ ('0'+date.getMonth()).slice(-2)+'/'+ ('0'+date.getDate()).slice(-2)); var curColumn = streamColumns[dateStr]; if (curColumn == null) { //add a new column for this date curColumn = new StreamColumn(); streamColumns[dateStr] = curColumn; } curColumn.addItem(val); } ); |
Note that when we add an ‘item’ to a column, we add it as an object ‘keyed’ on the ‘partition id’ to allow us to access the items by partitionId.
1 2 3 4 5 | StreamColumn.prototype.addItem = function(item) { this.items[item.partition] = item; this.totalScore += item.score; } |
By now we have all the data placed into ‘date’ columns. Optionally, at this point we can fill in some of the blanks, either by insisting that each column ‘stack’ contains all of the partitions/series and adding 0 scored items where they are not already there, or by ‘bridging’ series across columns with missing values as below:
We do this by looking at each series in a stack, checking to see if it is in the previous column, and if not, we check the column before that, if it is in that ‘previous-previous column’, then we add a 0 scoring item of that series to the previous column.
1 2 3 4 5 6 7 8 9 10 11 12 13 14 15 16 17 18 19 20 21 22 23 24 25 26 27 28 | //insert 'bridging' items for (var key in curColumn.items) { var curItem = curColumn.items[key]; var prevItem = prevColumn.items[key]; //look for an item //from the same partition //in the previous stack if (prevItem == null) //set this as this item's 'prevItem'; { if (i>1) //check the previous-previous stack for occurrence { var prevPrevColumn = streamColumns[columnKeys[i-2]]; var prevPrevItem = prevPrevColumn.items[key]; if (prevPrevItem != null) { //add a 'bridge' intermediate item //to the previous column var bridgeItem; bridgeItem.score=0; bridgeItem.partition=curItem.partition; bridgeItem.name=curItem.name; prevColumn.addItem(bridgeItem); } } } } |
2. Prepare the layout
First we sort the columns into date order ( by sorting our ‘map’ of StreamColumns by the date/column label ). Next we sort each stack into descending score order (we could optionally sort by series name - which would give us a stacked area graph essentially).
Finally, we iterate through each column and mark out a stack of rectangles, where the width is defined in ‘columnWidth’ and the height is the score * yScale. The yScale can be decided in two ways
- (locally scaled/non proportional) The column height in pixels / The total score of that column (all items scores added). This will give a graph where every column is the same total height. Item heights are not comparable scross columns.
- (proportional/globally scaled) The column height in pixels / The column total score in the whole graph. This makes the item heights comparable across columns.
3. Draw the graph
Finally, we draw the graph using SVG tags. Essentially we draw a stack of rectangles but with a twist: for each item, we check to see if there is an item of the same series in the previous column, if there isn’t, we draw a simple rectangle. If there is however, we draw the a path that starts at the top-right corner of the previous rectangle and follows a Bezier curve to the top left of this item rectangle, following round the rectangle and then back via a bezier curve to the bottom right of the previous rectangle. This creates a nice join between the two columns.
1 2 3 4 5 6 7 8 9 10 11 12 13 14 15 16 17 18 19 20 | if (prevItem==null) //just draw rectangle { curItem.colour = chartItemColours[(colourIdx++) % chartItemColours.length]; pathStr = "M"+curItem.left+","+curItem.top+" L"+curItem.right+","+curItem.top+ " L"+curItem.right+","+curItem.bottom+ " L"+curItem.left+","+curItem.bottom+" Z"; } else //draw a rectangle with a Bezier 'join' to the rect of the item in the //same series in the previous column { curItem.colour = prevItem.colour; var midX = prevItem.right + ((curItem.left - prevItem.right) / 2); pathStr = "M" + (prevItem.right-1)+","+prevItem.top+" C"+midX+","+ prevItem.top+" "+midX+","+curItem.top+" "+curItem.left+","+curItem.top+ " L"+curItem.right+","+curItem.top+ " L"+curItem.right+","+curItem.bottom+ " L"+curItem.left+","+curItem.bottom+ " C"+midX+","+curItem.bottom+" "+midX+ ","+prevItem.bottom+" "+(prevItem.right-1)+","+prevItem.bottom+" Z"; } |
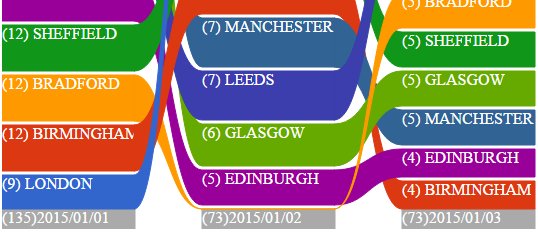
Example - Temperatures in 2015 in major UK cities.
The HTML is here, the Javascript is here and the data JSON is here.